What Claude Code loads before you type, and what it costs
Every session opens with a prefix you did not write and then re-sends it on every turn. Measured on one machine: 57,514 input tokens on the first turn, 15,988 of them configuration someone chose. What is in that number, which line is biggest, and how to get yours.
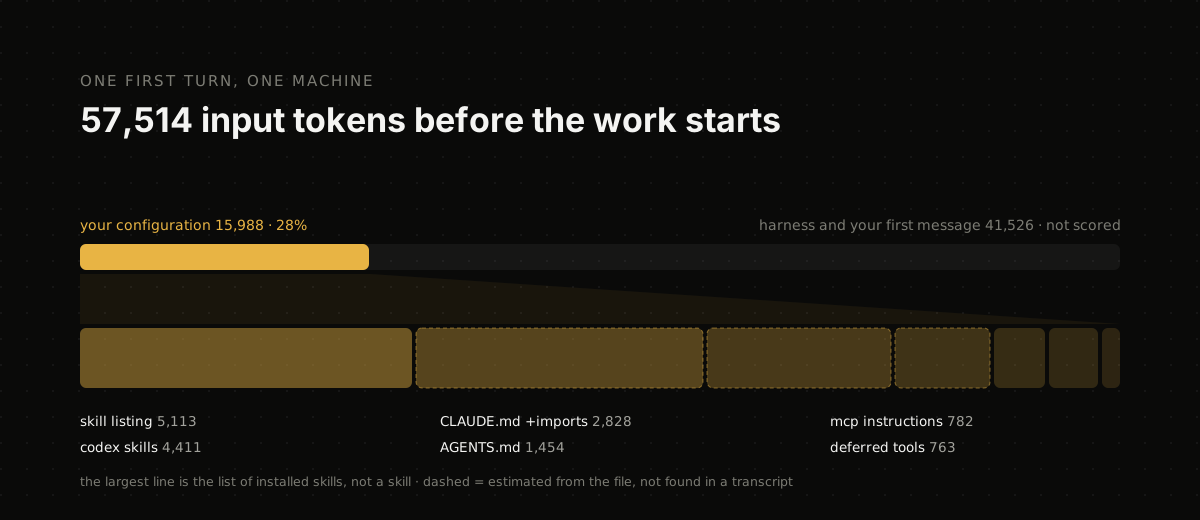
Before a coding agent reads your first sentence it has already been sent a prefix: a system prompt, tool schemas, the names and descriptions of every skill you have installed, your instruction files, and the instructions of every MCP server you connected. You did not write most of it. You are billed for all of it, on every turn, for as long as the session lives.
On the machine that wrote this post, that first turn was 57,514 input tokens, and 15,988 of them — 28% — were configuration the developer chose and can change. The rest is the harness’s own prompt, its built-in tool schemas and the first message.
Both numbers matter, and the second one is the one people get wrong. Published estimates for this overhead range from 20,000–30,000 tokens to around 55,000 for a five-server MCP setup. Those are ranges from other people’s laptops. The useful figure is yours, and it is sitting in your session transcripts already.
How many tokens does a session cost before you type?
Here is the whole first turn, decomposed. Measured means the string was found in a transcript and counted; estimated means the component appeared in no transcript and was sized from the file it comes from.
| Component | Tokens | Provenance |
|---|---|---|
| Skill listing (names and descriptions of installed skills) | 5,113 | measured |
| Codex skill instructions | 4,411 | estimated |
CLAUDE.md and its imports |
2,828 | estimated |
AGENTS.md |
1,454 | estimated |
| MCP server instructions | 782 | measured |
| Deferred tool listing | 763 | measured |
| Subagent listing | 637 | measured |
| SessionStart hook output | 0 | measured |
| Your configuration | 15,988 | |
| Harness prompt, tool schemas, your first message | 41,526 | not scored |
| First turn, input + cache write + cache read | 57,514 |
Two things to notice before the interesting one. First, 8,693 of the 15,988 is estimated rather than measured — a component that appears in no transcript can only be sized from its file, and a number that cannot say which of the two it is should not be trusted. Second, the harness’s 41,526 is not waste and is not yours: naming it and refusing to score it is what keeps the 15,988 honest.
Why is the biggest line the list of skills, not a skill?
Because skills are the part that already works properly. A skill’s body loads when it is invoked; what loads unconditionally is its name and description, so the agent knows the skill exists. Anthropic’s guidance is explicit that this is the design — MCP tool definitions are deferred by default, “so only tool names and server instructions enter context until Claude uses a specific tool.”
That is why the MCP line above reads 782 tokens and not 55,000. Deferred loading works. The cost that survives it is the index: one line per unit, multiplied by every unit you have ever installed and never removed. Eighty-seven installed units produced 5,113 tokens of listing before a single one of them did any work.
The practical consequence inverts the usual advice. Trimming the body of a skill you use saves you nothing at session start. Deleting a skill you do not use saves its line in the index, every turn, forever.
Doesn’t /context already show this?
Partly, and it is the right first thing to run. /context draws the current window, and /usage on a Pro, Max, Team or Enterprise plan goes further: it attributes recent usage to skills, subagents, plugins and individual MCP servers as a percentage of the total.
Three gaps are worth knowing about. Anthropic states them plainly: the figures are “approximate and computed from local session history on this machine,” they cover the last 24 hours or 7 days, and usage from other devices is not included. They are also Claude Code’s own view — Codex has its own configuration on the same laptop, and nothing shows you both at once.
So /context answers “what is in the window in front of me.” The questions it does not answer are “which of these units has earned its place over the last thirty days”, “what is the absolute token cost of this one line”, and “what does the same developer’s other agent load.” Those need a pass over the history rather than a snapshot of the present.
What does re-sending it on every turn actually cost?
The mechanic, in Anthropic’s words: “Claude Code sends your full conversation with every request, and each time Claude uses tools it sends another request carrying that batch of tool results.” Prompt caching softens this — the stable prefix is re-read at the cached token rate rather than the input rate — but softened is not free, and the cache is exactly what a configuration change invalidates.
Do the arithmetic with your own numbers rather than ours. Configuration tokens times turns per day times developers times working days, priced at your cache-read rate, with the misses priced at full input. The multiplication is the entire argument: a 16k prefix loaded once is a rounding error, and the same 16k on every turn of every session of every engineer is a line item.
For scale on the other side of that equation, Anthropic publishes the only good public anchor: “around $13 per developer per active day and $150-250 per developer per month, with costs remaining below $30 per active day for 90% of users.”
What do you actually delete?
Here is where most audits go wrong. It is tempting to count installed units against used ones and call the difference waste. On the machine above that ratio is 87 installed, 8 used — which sounds damning and is not a finding.
Of those 87, only 20 appeared in any session in the window at all. The other 67 are not evidence of anything: an audit that never observed a unit cannot tell an unused one from one that a session simply did not need that month. Unmeasured is not unused, and the honest score is 8 of 20, with 67 reported separately as unmeasured.
What survives that filter is a short, boring, actionable list: the plugin whose six skills are all cold, the skill installed twice under two names, the MCP server whose instructions load on every turn and whose tools were called zero times. Group the findings and a 100-token cold skill correctly disappears from the report.
What doesn’t work
Three approaches that look reasonable and are not.
Deleting CLAUDE.md. It is one of the larger lines, so it draws attention, and it is also the line doing the most work per token. Anthropic’s own guidance is to keep it under 200 lines and move specialised instructions into skills — which load on demand — not to empty it. Cutting the file that prevents re-explaining your build system every session is a saving that pays for itself in re-work.
Sizing components from file sizes. chars / 4 on a directory of skill files answers a different question from “what text was injected.” Bodies that never load are counted; a listing that loads every turn is missed; imports are missed entirely. If the number you are acting on came from du, it is measuring the wrong object.
Optimising the session and ignoring the prefix. /clear between tasks is genuinely the highest-value habit, and it resets nothing about the 15,988 — that gets re-sent at the top of the next session too. The two are different budgets and only one of them is a habit.
How to measure your own machine
Everything above came out of transcripts that Claude Code and Codex had already written to disk. No instrumentation was added, because the data was already there.
We wrote slopmeter to read it: one Go binary, offline, read-only, no account, no hooks, no daemon. It prints the first-turn decomposition above for your machine, tags every number measured or estimated, names the units nothing has touched in thirty days, and — separately — scores the repository your agents are working in for over-engineering, untested logic and unreviewable commits. It is Apache 2.0 and it opens with its first tagged release.
Two other open-source tools read the same data with different trade-offs, and if they fit your setup better you should use them. context-analyzer installs hooks into ~/.claude/settings.json and keeps a SQLite database with a FastAPI dashboard, which buys you per-call forensics we do not attempt — its headline finding is that calls cost 4.3× more at large context than small, $0.23 per call at 63K tokens against $0.98 at 721K. context-viewer is a local Python web app over the same transcripts. Both are richer than a static binary and both are more to install and keep running.
The measurement is the cheap part. What the number changes is whether “we have a lot of tooling installed” is an opinion or a line you can point at.
Related reading
- What makes a two-hour session cost $1,200 — the four token classes and their multipliers, which is the pricing model underneath the arithmetic above.
- The number your developers see is not the number you pay — why a local cost figure and an invoice diverge.
- Uber burned its 2026 AI budget in four months, then cut cost per session 52% — the same idea at 5,000 engineers, with the levers they actually pulled.
Sources
- Manage costs effectively — Claude Code documentation: per-developer figures, deferred MCP tool definitions,
/usageattribution and its stated limits,CLAUDE.mdguidance. - Prompt caching and pricing — cache lifetime and the cached-token rate.
- context-analyzer — cost-per-call scaling with context size.
- Component figures are one recorded
slopmeter envrun on one machine, 2026-09-09, with provenance as tagged in the table.
decost applies these levers to Claude Code & Codex traffic automatically — and you pay from measured savings.
Get a free spend audit